排放因子数据库
Emission factor database
整合主流碳排放因子数据库,翻译并校正,助力企业碳排放管理


未匹配到排放因子
请选择排放因子库后输入关键词进行检索
三种主流碳排放核算方法
 排放因子法
排放因子法 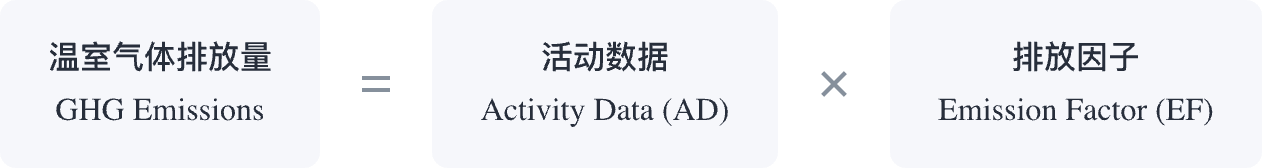
依据特定能源类型的排放因子,将活动数据(如燃料消耗量)转换为温室气体排放量。排放因子通常由权威机构提供,反映了单位能源使用导致的温室气体排放。
质量平衡法 通过质量守恒原理,计算原料投入的碳含量与产品产出、废物输出的碳含量之差,从而确定系统边界内的碳排放量。适用于工艺过程复杂、排放源多样的工业系统。
 实测法
实测法 通过直接测量排放源的温室气体排放浓度和流量来确定排放量。现场测量通常利用连续排放监测系统(CEMS),而非现场测量则涉及采样后在实验室进行分析。
免责声明:ESGEase 排放因子库提供的数据来源于网络,仅供学习参考使用,对于使用该数据可能引起的任何纠纷或后果,我们不承担任何责任。